Stat H 309 - Regression Analysis & Hypothesis Testing with R Programming
I have shared solutions to the previous year's final exam questions for the Stat H - 309 course (Regression Analysis and Hypothesis Testing) using R programming. These questions are from affiliated colleges under the University of Dhaka.
Run R Programming Code
While you can execute R code directly within this webpage for quick practice, I would always recommend establishing your R programming environment using RStudio on your local machine. RStudio provides a robust and feature-rich platform for professional R development.
Year Final 2023
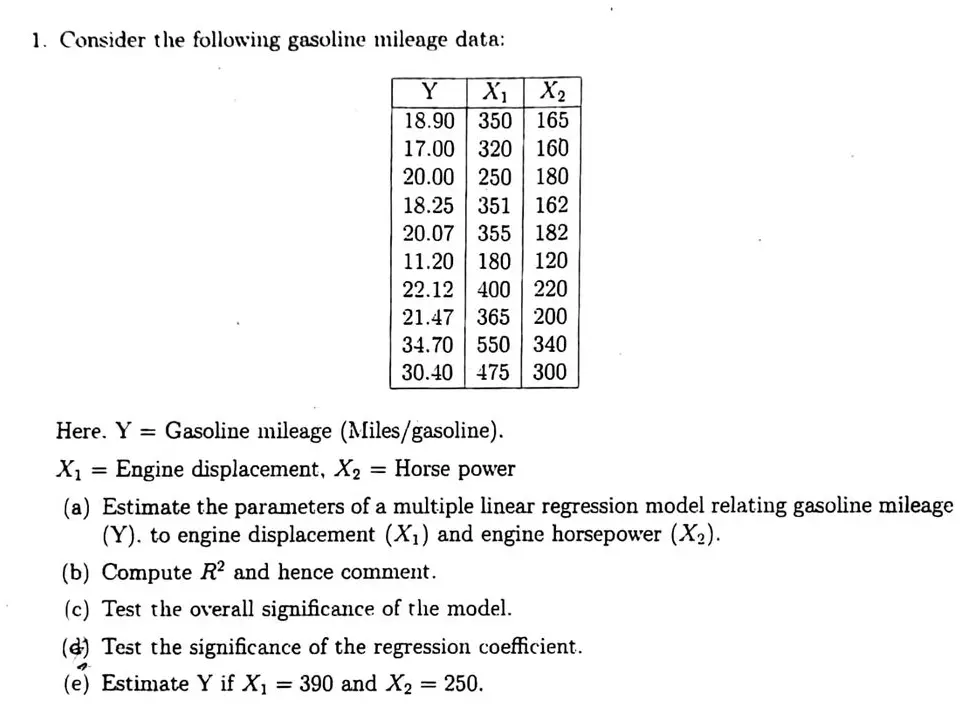
# Hon's 3rd year Final 2023 Q1
# gasoline mileage data
y <- c(18.90, 17.00, 20.00, 18.25, 20.07, 11.20, 22.12, 21.47, 34.70, 30.40)
x1 <- c(350, 320, 250, 351, 355, 180, 400, 365, 550, 475)
x2 <- c(165, 160, 180, 162, 182, 120, 220, 200, 340, 300)

# data frame
data <- data.frame(y, x1, x2)

# Fit multiple linear regression model
model <- lm(y ~ x1 + x2, data = data)

# Summary of the model
summary(model)

# Estimate Y when x1 = 390 and x2 = 250
new_data <- data.frame(x1 = 390, x2 = 250)
predicted_y <- predict(model, newdata = new_data)

# output
print(paste("Estimated Y (gasoline mileage) when x1 = 390 and x2 = 250:", predicted_y))
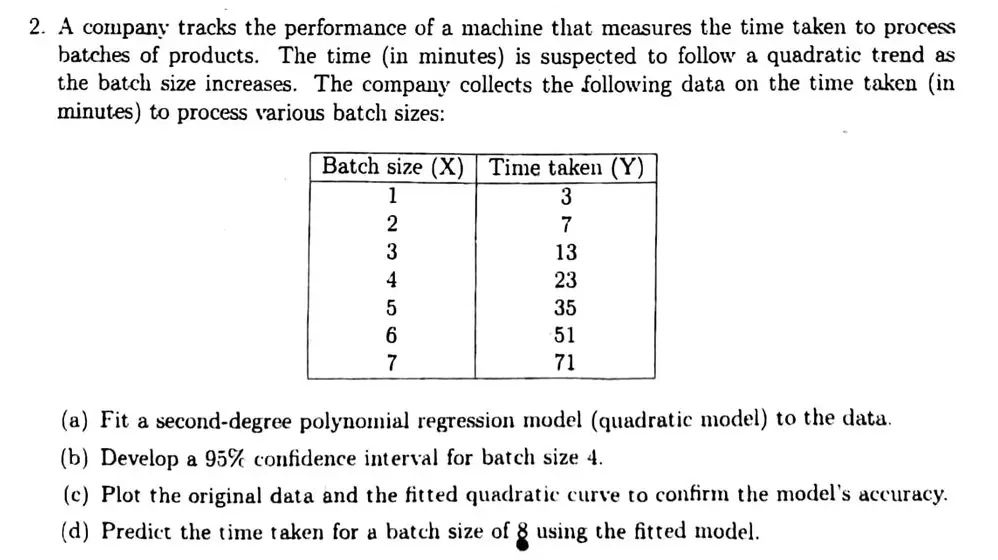
# Hon's 3rd year Final 2023 Q2
# Data
x <- c(1:7)
y <- c(3, 7, 13, 23, 35, 51, 71)

# model fit
model <- lm(y ~ x + I(x^2))

# Summary
summary(model)

# Confidence interval
new_data <- data.frame(x = 4)
ci <- predict(model, newdata = new_data, interval = "confidence", level = 0.95)
print(ci)

# Plot
plot(x, y, main = "Quadratic Regression", xlab = "Batch Size", ylab = "Time")
lines(x, fitted(model), col = "red")

# Prediction
new_data2 <- data.frame(x = 8)
prediction <- predict(model, newdata = new_data2)
print(paste("Predicted time for batch size 8:", prediction))
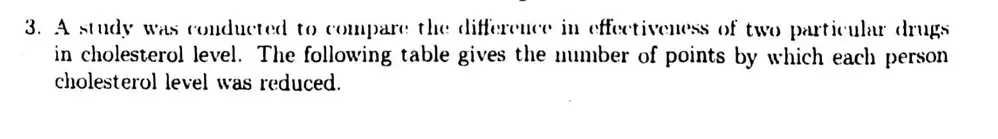
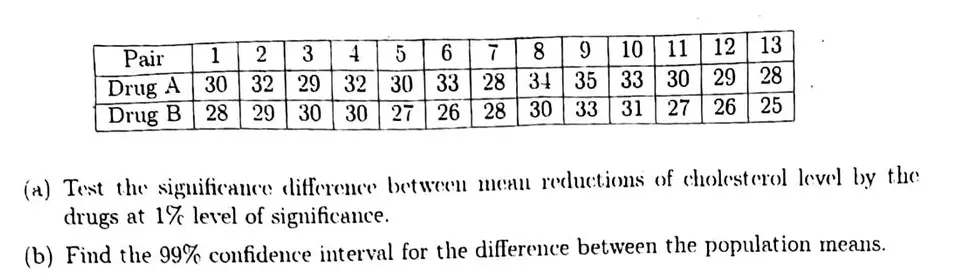
# Hon's 3rd year Final 2023 Q3
# Data
pair <- c(1:13)
drug_a <- c(30, 32, 29, 32, 30, 33, 28, 34, 35, 33, 30, 29, 28)
drug_b <- c(28, 29, 30, 30, 27, 26, 28, 30, 33, 31, 27, 26, 25)

# Calculate the differences
differences <- drug_a - drug_b

# Paired t-test
t_test_result <- t.test(differences, mu = 0, paired = TRUE, alternative = "two.sided", conf.level = 0.99)
print(t_test_result)

# 99% Confidence Interval
ci <- t.test(differences, mu = 0, alternative = "two.sided", conf.level = 0.99)$conf.int
print(ci)
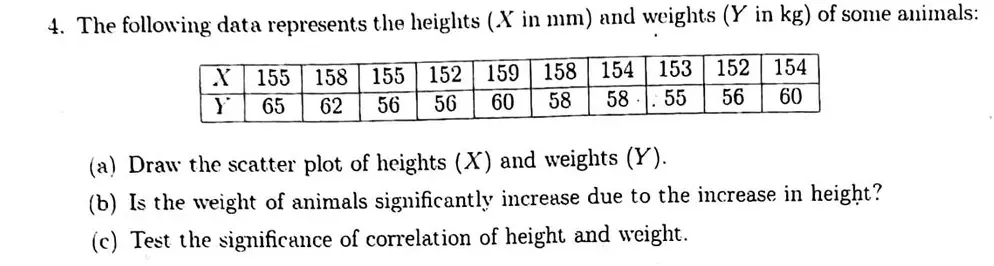
# Hon's 3rd year Final 2023 Q4
# Data
x <- c(155, 158, 155, 152, 159, 158, 154, 153, 152, 154)
y <- c(65, 62, 56, 56, 60, 58, 58, 55, 56, 60)

# Scatter Plot
plot(x, y,
     xlab = "Height (mm)",
     ylab = "Weight (kg)",
     main = "Scatter Plot of Height vs. Weight")

# Correlation Test
correlation_test_result <- cor.test(x, y)
print(correlation_test_result)
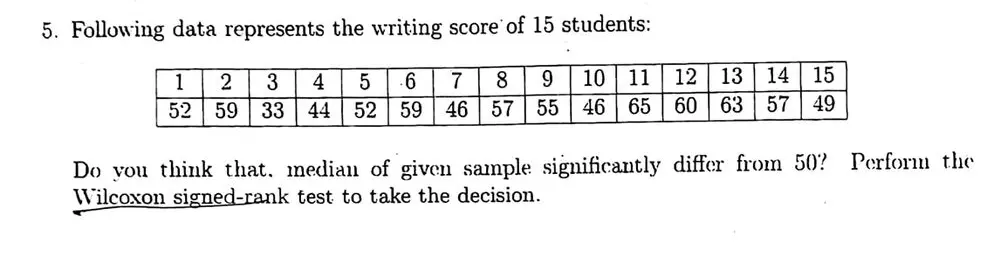
# Hon's 3rd year Final 2023 Q5
# Data
x <- c(1:15)
y <- c(52, 59, 33, 44, 52, 59, 46, 57, 55, 46, 65, 60, 63, 57, 49)

# Perform Wilcoxon signed-rank test
wilcox_result <- wilcox.test(y, mu = 50, conf.level = 0.95)
print(wilcox_result)