Personal Financial Analysis Dashboard
Dynamic DashboardComplex FuntionsConditional FormattingData Validation
I designed this Excel dashboard to bring clarity to my personal finances. It organizes my income, expenses, and savings in one cohesive system, giving me a comprehensive view of my financial health. By leveraging advanced data presentation techniques, I transformed complex financial data into understandable, actionable insights that help me to make informed decisions with confidence.
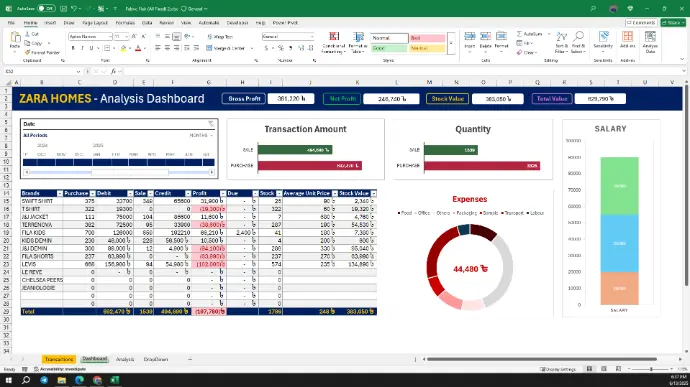
Inventory Management System
Interactive DashboardComplex FuntionsPivot TablePivot ChartsData Validation
I developed a custom Excel Inventory Management System for a client to streamline stock tracking & financial insights. After understanding their needs, I designed an interactive dashboard delivering real-time visibility into stock levels, value, and expenses. The solution eliminated manual work with dynamic filtering/visuals. Refined via feedback for accuracy, it now drives efficient inventory management.

Analyzing Sales Data with Python
PandasNumphyOpenPyXLSeabornAI
Sales data was cleaned, analyzed, and visualized. Automated reports, including key metrics, were generated and emailed, highlighting top performers, revenue growth, and customer retention.
Web Scraping with Python
ScrapyI have scrapped data from multiple webpages with Python - Scrapy framework. It's fast way to collect data from webpages that can be used to for market research or analytics.
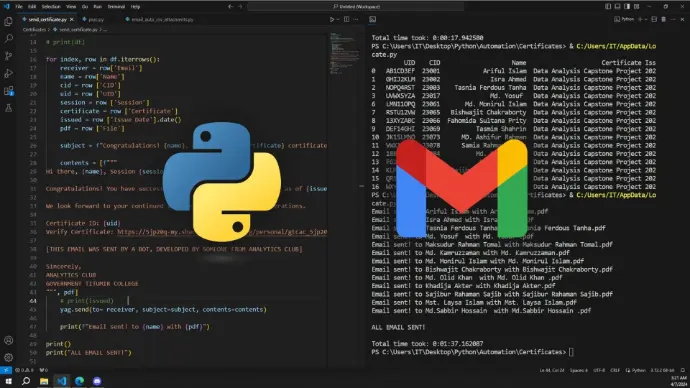
Email Automation
Scrapyyagmail CSV / ExcelAutomation
I've developed a Python script that automates personalized email sending via GMAIL. It works directly from CSV/EXCEL files and includes attachments.

Regression Analysis
Simple Linear
Multiple Linear
Prediction
Model
In Stat H-309 Lab Course, I learned estimating and interpreting multiple regression models, including overall significance tests and hypothesis testing for individual parameters with confidence intervals. I gained expertise in partial and multiple correlation, model selection, and fitting polynomial regression, including orthogonal polynomials. This enables me to build and analyze robust statistical models for data-driven insights.

Test of Hypothesis
t-testPaired t-testWilcoxonIn Stat H-309 Lab Course, I learned to test hypotheses for single and two-sample data, including means, variances, and proportions, and analyze differences between samples using methods like the paired t-test. I also explored the significance of correlation and regression coefficients. My studies covered homogeneity and goodness-of-fit tests, and practical experience with non-parametric methods like the Sign, Rank and Median tests.
View Details